Meteorologists Just Released Snowfall Predictions For This Winter—Here’s Where Flakes Are Most Likely to Fly
It’s been nearly a decade since El Niño, a natural tropical Pacific weather and ocean pattern, has been as strong as it will be this winter. The last time it really made waves—the chilly season spanning 2015 to 2016—the contiguous U.S. experienced its warmest winter on record, according to the National Oceanic and Atmospheric Administration (NOAA).
Scientists at NOAA refer to previous moderate-to-strong El Niño winters to try to predict what Mother Nature has in store for winter 2022 to 2023. That being said, just like no two snowflakes are alike, no two El Niño winters are identical. That being said, robust El Niño years generally usher in an era of:
That’s precisely what NOAA anticipates for this winter. Still, since many locales are always above 32 degrees F, “wetter” doesn’t always translate to more snow. Plus, snowfall levels can vary widely even when comparing one city to another in the same state.
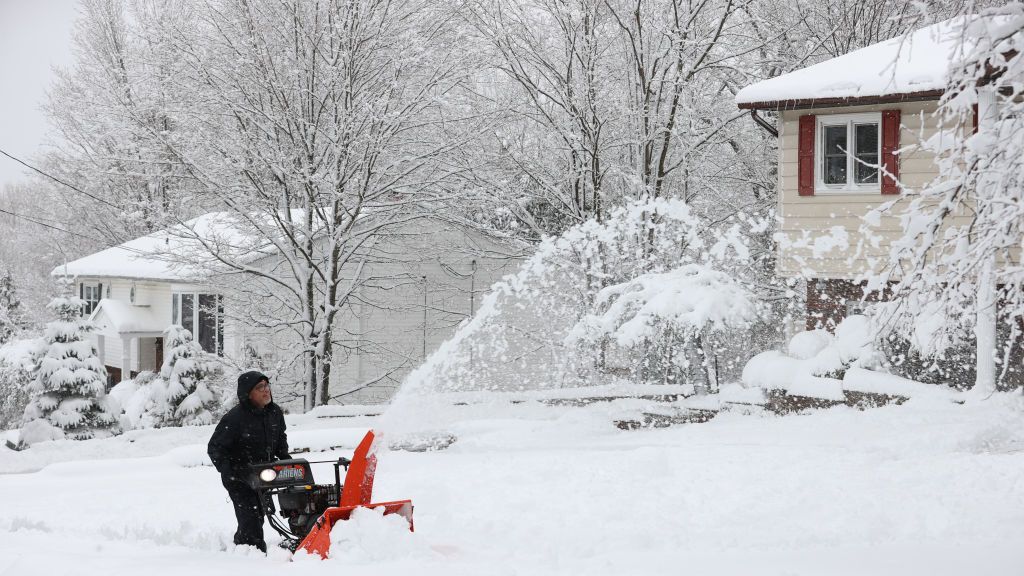
To help us all know whether we need to dust off our shovels or refuel or charge our snowblowers, NOAA scientists just released new maps to reveal where snow is more or less likely during El Niño-strong seasons (including this one). Worth noting: Many factors beyond El Niño, including atmospheric and climatological fluctuations, play a role in actual snowfall amounts. Plus, these guides are looking back rather than forward, so they can’t be read as forecasts of how many feet or inches of flakes we can expect.
Michelle L’Heureux, one of the two scientists behind these new maps, admits in a NOAA blog post that “El Niño nudges the odds in favor of certain climate outcomes, but never ensures them.”
NOAA’s maps are expert-crafted and data-backed. However, just like the yearly Old Farmer’s Almanac, you shouldn’t place your money (or invest in your snow removal tools or staff) based on the results. These snowfall maps are simply fun to study—and compare to what happens by the end of the season.
In a normal winter (January through March), the jet stream pushes south, nudging storms down, too. As a result, northwestern and northeastern states are fairly dry. Wetter and snowier conditions are the norm across the south, especially in southwest states.
The stronger El Niño is, the larger role in plays in our weather patterns. According to NOAA, these regions and cities may experience higher than usual levels of snowfall or rain this winter:
At the same time, these regions might notice dryer winters than in recent past:
Only time will tell who among us will be digging out from the biggest blasts (and enjoying some stunning snowglobe-like scenery!).
You Might Also Like


 Bitcoin
  Ethereum
  Tether
  XRP
XRP  USDC
USDC  Solana
  TRON
TRON  Dogecoin
  Lido Staked Ether